
The 2026 Art Basel and UBS Global Art Market Report arrived to considerable attention in March, documenting the market's 4% recovery to $59.6 billion after two consecutive years of decline. Headlines focused on the positive direction, noting that public auction sales rose 9% to $20.7 billion, driven substantially by Gustav Klimt's Portrait of Elisabeth Lederer selling for $236.4 million at Sotheby's in November 2025, setting a new record for modern art at auction. The report cited improved dealer confidence, with 43% expecting sales growth in 2026 compared to 33% the prior year. Read selectively, these numbers paint a picture of a market recovering its momentum.
Yet the same report revealed that despite modest growth, the market remains 9% below its 2023 level and 7% below 2015 values. Contemporary art sales remained stagnant while Impressionist and Old Master categories gained 47% and 30% respectively, representing a structural rebalancing rather than broad-based recovery. The average number of buyers per gallery dropped to 57, the lowest since 2021, and galleries with turnover between $500,000 and $1 million reported the largest decline in confidence. Online sales fell to $9.2 billion, their lowest level since 2019. The data tells a far more nuanced story than headline figures suggest.
This gap between headline statistics and underlying complexity illustrates the fundamental challenge facing collectors who attempt to use art market indices as investment guidance. Unlike stock indices that track real-time transactions across liquid markets with transparent pricing, art indices rely on methodologies developed to measure inherently opaque, illiquid, and heterogeneous markets. Understanding their limitations isn't pessimism—it's the foundation of intelligent collecting.
Discover how curated selection addresses market opacity at Artestial, where collectors access works with transparent provenance and institutional validation that indices cannot capture.
The Architecture of Art Market Measurement
How Major Indices Actually Work
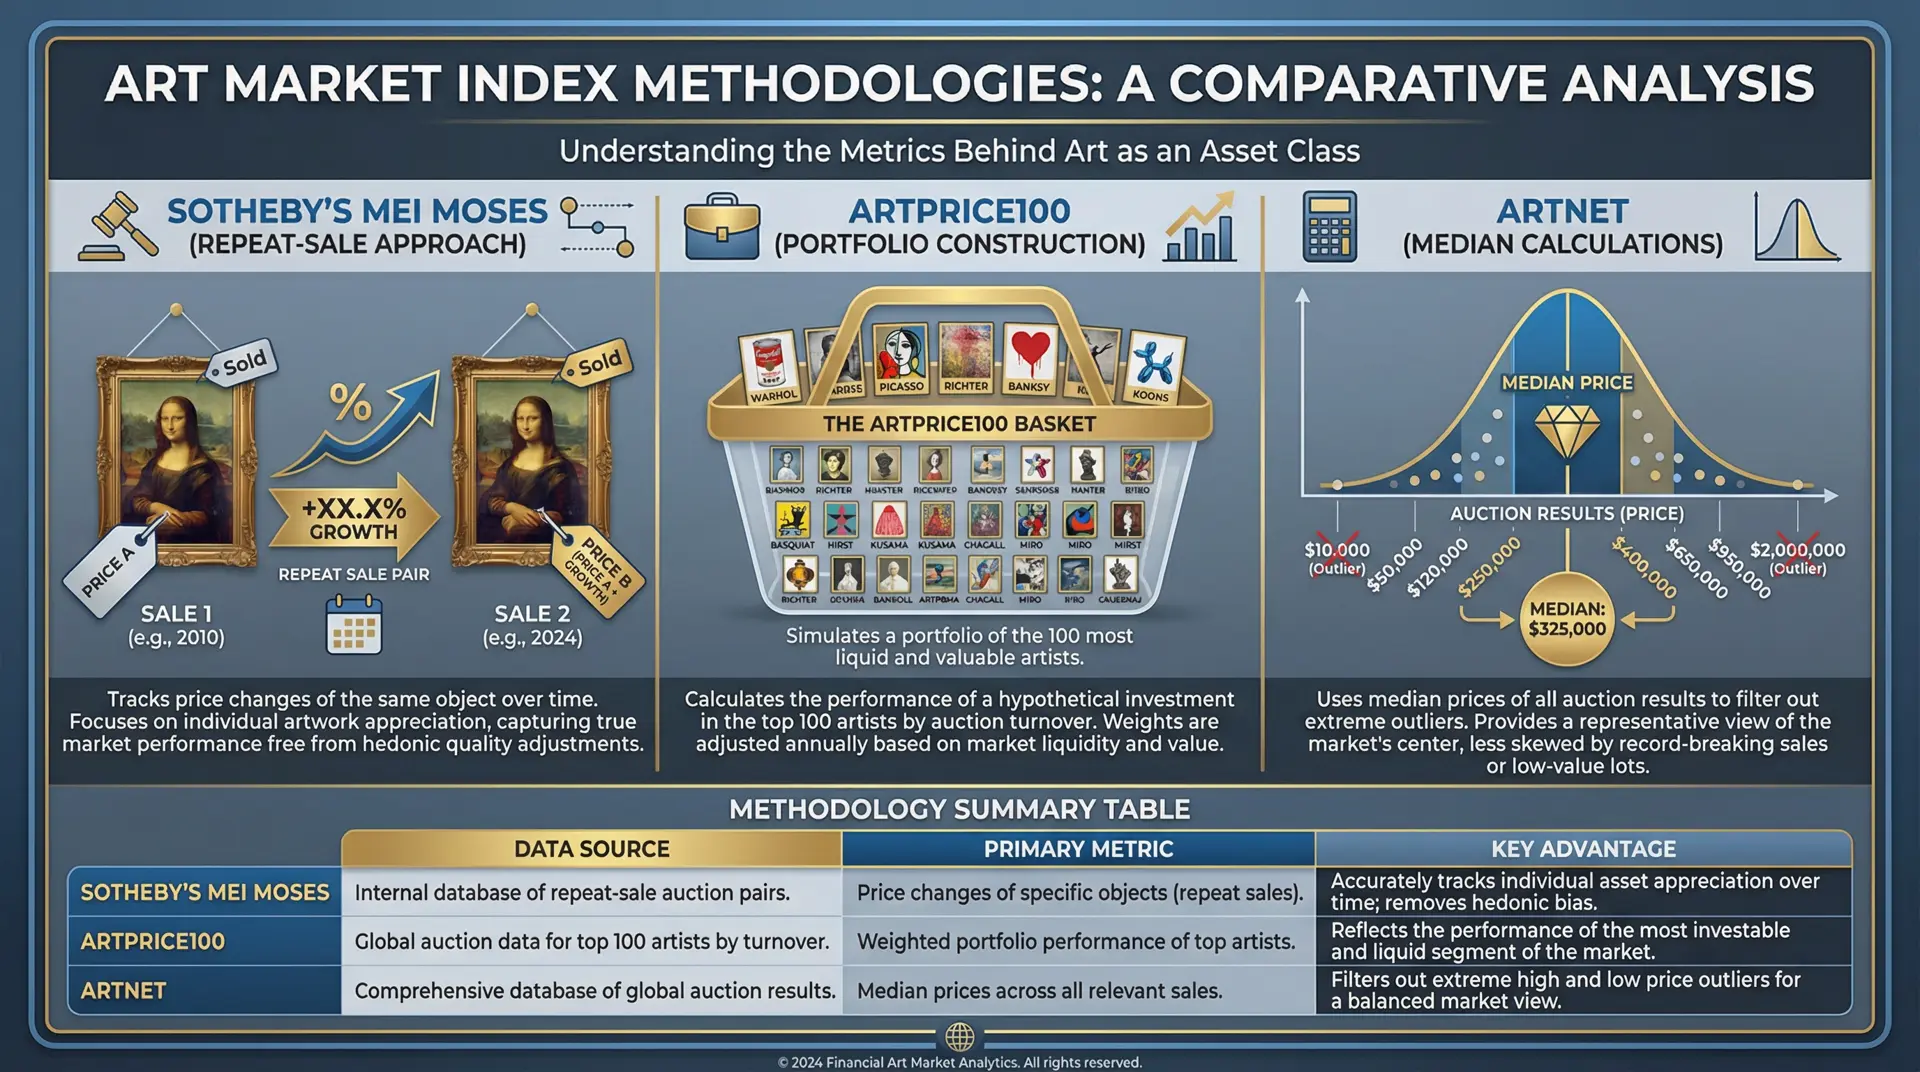
The art market currently offers several prominent indices, each constructed through fundamentally different methodologies that produce divergent results. Understanding these differences reveals why no single index provides complete market visibility.
Sotheby's Mei Moses indices, developed in 2002 by NYU professors Jianping Mei and Michael Moses and acquired by Sotheby's in 2016, employ repeat-sale regression methodology borrowed from the Case-Shiller real estate index. The system tracks works that have sold at auction more than once at Sotheby's, Christie's, and Phillips, comparing the price difference between sales to calculate appreciation rates. The database covers approximately 80,000 works by more than 10,000 artists going back roughly 200 years, with about 4,000 works reselling each year adding new data points. The methodology's strength lies in its apples-to-apples comparison of identical works across time, eliminating the problem of comparing fundamentally different objects.
The Artprice100, launched in 2018 by Artmarket.com, takes a different approach. The index constructs a theoretical portfolio of the 100 most successful artists based on their auction revenue over the previous five years, weighted by market turnover and adjusted for liquidity. To qualify, an artist must have sold at least ten works annually at auction, excluding prints and multiples. The composition updates each January, with roughly four artists entering and four exiting annually. Since 2000, the Artprice100 has risen approximately 589%, outperforming the S&P 500's 224% gain over the same period, generating an average annual return of 8.9%.
Artnet's indices draw from the company's price database covering more than 1,800 auction houses and 340,000 artists with data extending back to 1985. The platform tracks seven standard indices including Top 100 Artists, European Old Masters, Impressionist Art, Modern Art, Post-War Art, Contemporary Art, and Chinese Art. Rather than repeat sales, Artnet calculates median prices for each artist and weights them equally, dampening the effect of outlier sales and providing broader market representation than repeat-sale methodologies.
Newer entrants like the MAB100, developed by MyArtBroker, focus specifically on the print market, tracking the top 100 editioned works based on value, demand, and repeat sales. Because prints share consistent characteristics across impressions, the index enables more meaningful comparisons than unique works allow. The methodology incorporates both public auction and private sale data from over 350 auction houses, addressing one of the major limitations of traditional indices.
The Private Sale Problem
Every major art market index confronts the same structural limitation: they measure only what they can see. According to the 2026 Art Basel and UBS report, the dealer sector accounts for $34.8 billion of the $59.6 billion total market, with the majority of those transactions occurring privately without public price disclosure. Even within the auction sector, private sales at auction houses represent just under $4.2 billion, transactions that occur off the public record and therefore outside index calculations.
Clare McAndrew, founder of Arts Economics and author of the annual Art Basel and UBS report, has noted that indices based on auction sales ignore retail and private sales entirely. For collectors, this means indices capture perhaps 35-40% of total market activity at best. The works that change hands privately often represent the highest quality and most desirable pieces, as sellers of exceptional material frequently prefer the discretion and control of private transactions over the competitive uncertainty of public auction.
This creates systematic selection bias. Works that appear at auction tend to be those that sellers believe will benefit from competitive bidding dynamics, often either exceptional works expected to attract aggressive competition or works whose market is uncertain enough that auction exposure might maximize price discovery. Middle-tier works with established markets often trade privately, creating a hole in the data that indices cannot address.
Survivorship Bias and the Excluded Majority
Perhaps the most significant limitation of art market indices involves what they exclude rather than what they measure. Doug Woodham, former president of Christie's Americas, observed when Sotheby's acquired the Mei Moses indices that "if it's not investable, it fails the primary test of being an index." His critique points to a fundamental problem: art indices track historical returns on works that successfully returned to market, excluding the vast majority of acquisitions that never resold publicly.
The repeat-sale methodology by definition excludes works that sold only once. If a collector purchases a painting that subsequently proves difficult to resell, that transaction contributes nothing to index calculations. If an artist's market collapses and works fail to attract auction interest, those failures never appear in the data. The index therefore systematically overstates returns by including only works that successfully found buyers multiple times.
Works that fail to sell at auction compound this bias. Most indices exclude unsold lots from calculations, counting only "winners" while ignoring works that failed to meet reserves. During the 2008-2009 financial crisis, for example, buy-in rates at major auction houses approached 40% for some categories, yet indices constructed from that period reflect only the 60% that sold. Without reserves and guarantees, works might have sold at fractions of their estimates, but that potential downside never appears in historical returns.
The Transaction Cost Illusion
What Indices Never Measure
When the Artprice100 reports an 8.9% average annual return since 2000, that figure represents gross appreciation before any consideration of the substantial costs involved in buying, holding, and selling art. For collectors attempting to translate index returns into actual investment outcomes, these costs fundamentally alter the calculation.
The buyer's premium at major auction houses currently runs 25-28% on the first $500,000 to $2 million, dropping to 20% above those thresholds and 10% or less above $6 million. On a $100,000 hammer price, the buyer pays approximately $125,000-$130,000 including premiums. The seller, meanwhile, faces commissions typically starting at 15% of hammer price, though this is often negotiable for desirable consignments. Additional seller costs include photography, marketing, insurance during consignment, and potentially restoration or conservation work before sale.
Taking both sides together, a work that hammers at $100,000 might cost the buyer $130,000 while returning the seller perhaps $85,000-$90,000 after commissions and costs. The roundtrip transaction cost approaches 30-35% for mid-market works, meaning a painting must appreciate approximately 35% just to break even if sold through the same channels at the same hammer price.
Explore how transparent pricing structures protect collector value at Artestial, where acquisition costs are clearly communicated and gallery margins don't erode investment returns.
Holding Costs the Data Ignores
Between acquisition and sale, art requires ongoing expenditure that indices never capture. Insurance typically runs 0.3-0.5% of appraised value annually, with specialized fine art coverage from carriers like AXA XL, Hiscox, or Chubb commanding premiums proportional to collection value, installation locations, and exhibition activity. A $500,000 collection might require $1,500-$2,500 annually in premiums alone.
Conservation and maintenance add further expense. Climate-controlled storage for works not on display can cost $25-$75 per square foot monthly in major markets, with a medium-sized collection potentially requiring $3,000-$10,000 annually in storage fees. Conservation assessment, cleaning, and condition maintenance represent additional periodic costs that vary by medium, with works on paper requiring different interventions than paintings or sculptures.
Professional appraisals for insurance and estate planning purposes require periodic updates, typically every two to five years for active insurance coverage. Each appraisal carries fees ranging from a few hundred dollars for straightforward works to thousands for complex authentication questions. Documentation, photography, and condition reporting add further costs that index calculations never consider.
When Art Market Research analysed the transaction costs embedded in art ownership, estimates ranged from 3-5% of transaction value just for ancillary costs beyond commissions. Melanie Gerlis, art market columnist for the Financial Times and author of "Art as an Investment? A Survey of Comparative Assets," has noted that "nowhere in these returns is the holding cost of art, the insurance, the shipping, the conservation, the auction house fees." Academic studies that attempt to control for these factors systematically generate lower returns than industry-produced indices.
The Tax Dimension
For US-based collectors, the Internal Revenue Service treats art as a collectible, subjecting gains to a maximum 28% capital gains rate rather than the 20% long-term capital gains rate applicable to most financial assets. State taxes add further burden depending on jurisdiction. A collector in California or New York might face combined federal and state rates approaching 35-40% on appreciated art, substantially eroding returns that indices present before tax consideration.
Estate planning considerations further complicate the picture. Art often comprises significant portions of high-net-worth estates, yet only 24% of collectors surveyed in the 2025 Deloitte and ArtTactic Art & Finance Report have long-term plans for their collections. The 2025 report estimates $992 billion in art and collectibles will change hands over the next decade as part of intergenerational wealth transfer, with substantial friction costs embedded in estate administration, appraisal, and potentially forced liquidation.
What Indices Actually Tell Us
Sentiment and Confidence Signals
Despite their limitations, art indices provide valuable information when interpreted correctly. Rather than treating them as investment return predictors, sophisticated collectors read them as sentiment indicators revealing market psychology and confidence levels. When the Artprice100 gains 36% in a single year as it did in 2021, or shows only 1.55% growth in 2023 during market adjustment, these figures signal relative strength or weakness in collector confidence even if they don't predict individual returns.
The gap between blue-chip indices and broader market measures proves particularly informative. In 2022, when the Artprice100 gained 3% while Artprice's Global Index declined 18%, the divergence revealed flight-to-quality dynamics with collectors retreating to established names while speculative contemporary positions corrected. This pattern repeated in the 2025-2026 data showing Impressionist and Old Master categories outperforming contemporary while the ultra-high-end above $10 million drove auction recovery.
Comparing index performance across categories identifies structural shifts in collector preference. The fourth consecutive year of contemporary art auction decline noted in the 2026 report suggests more than cyclical adjustment, potentially reflecting fundamental rebalancing toward established historical categories. Collectors monitoring these trends can adjust strategies accordingly, recognizing that yesterday's momentum categories may not drive tomorrow's appreciation.
Relative Value and Market Timing
Indices provide useful context for evaluating whether current pricing seems high or low relative to historical trends. If an artist's index shows steady 6% annual appreciation over two decades but prices at auction suddenly spike 40% in a single year, the divergence suggests either fundamental revaluation or speculative excess likely to correct. Conversely, if an artist's prices stagnate while comparable peers appreciate, the relative underperformance may indicate value opportunity or emerging market concerns.
The 2026 Art Basel and UBS finding that the market remains 9% below 2023 levels and 7% below 2015 provides important context for current acquisitions. Collectors entering or expanding at present price levels aren't buying at historical peaks, potentially offering better entry points than those who acquired during 2021-2022 market highs. This contextual information proves more actionable than absolute return claims.
Building Intelligence Beyond Indices
Alternative Data Sources
Sophisticated collectors supplement index data with information sources that indices cannot capture. Gallery price histories, exhibition records, museum acquisition announcements, and critical reception create qualitative context that quantitative indices miss entirely. An artist whose work enters major museum collections signals institutional validation that may not yet appear in auction pricing but typically precedes market recognition.

The 2025 Deloitte and ArtTactic Art & Finance Report noted that 51% of wealth managers now offer art-related services, up from just 25% in 2011. This professionalization of collecting advice reflects recognition that successful art investment requires expertise indices cannot provide. Family offices report 13.4% average allocation to art and collectibles, compared to 8.6% for private banks, suggesting that the most sophisticated wealth structures treat art as significant portfolio component requiring dedicated management.
Connect with specialists at Artestial for guidance navigating market complexity beyond what indices reveal, with access to institutional-quality research and acquisition strategy.
The Diversification Question
Art's appeal to wealth managers rests partly on its historical low correlation with traditional asset classes. The 2026 Art Basel and UBS report cited Paul Donovan, Chief Economist at UBS Global Wealth Management, noting that the art market "has demonstrated a notable degree of resilience relative to many other industries" even amid modest and uneven growth. During the 2022 market environment when the S&P 500 declined 19%, blue-chip art held relatively steady with the Artprice100 gaining 3%.
Yet this diversification benefit requires caveats. Correlation increases during systemic crises when liquidity tightens across all asset classes. Art cannot be sold quickly during market stress without potentially accepting significant discounts, unlike public equities that can be liquidated instantly. The portfolio benefits of low correlation apply only to collectors with sufficient liquidity in other assets to avoid forced art sales during adverse conditions.
For collectors with appropriate time horizons and liquidity, art's diversification benefits remain genuine. The key lies in understanding that those benefits derive from art's illiquidity and unique characteristics rather than despite them. Treating art as a liquid investment vehicle misunderstands its fundamental nature.
Purpose-Driven Collection
The 2025 Deloitte and ArtTactic report documented a significant shift in collector motivation, particularly among next-generation buyers who prioritize cultural impact and legacy over financial returns. While 63% of collectors cite social value as their primary acquisition motivation, only 5% intend to donate collections to institutions, with 67% planning to pass holdings to heirs.
This purpose-driven approach may ultimately produce better investment outcomes than pure return optimization. Collectors who acquire works they genuinely appreciate typically maintain longer holding periods, allowing compounding effects to overcome transaction costs. Those who buy for expected appreciation often face shorter time horizons and potentially adverse timing, selling into weak markets when patience would be rewarded.
The irony of art investment is that treating it primarily as investment may undermine returns, while collecting for aesthetic and cultural reasons may incidentally produce financial benefits. Indices, which present art in purely financial terms, may inadvertently encourage the wrong approach.
The Index Investor's Paradox
What You Cannot Buy
The fundamental problem with art indices as investment guidance is that you cannot actually invest in them. Unlike the S&P 500, which can be purchased through index funds at minimal cost, no vehicle exists to acquire proportional exposure to the Artprice100 or Sotheby's Mei Moses basket. Each collector must make individual acquisition decisions, selecting specific works by specific artists at specific prices. The index represents theoretical returns on a theoretical portfolio that no real collector can replicate.
This matters because individual selections generate return distributions with enormous variance around index means. An investor purchasing an S&P 500 index fund knows their return will closely track the index. A collector purchasing art based on index-informed strategy might dramatically outperform or underperform depending on specific selections, timing, and eventual sales outcomes. The index provides no guarantee that individual decisions will cluster around its reported returns.
Fractional ownership platforms have attempted to address this limitation, allowing investors to purchase shares in individual works or portfolios. Platforms like Masterworks offer exposure to contemporary and modern art through SEC-regulated securities. Yet these structures introduce their own fees, potentially doubling the cost layer relative to direct ownership, while providing exposure to curatorial decisions over which investors have no control.
Academic versus Industry Indices
Perhaps unsurprisingly, indices created by academics studying art as an asset class systematically generate far lower returns at higher risk than indices published by art market businesses. Studies using similar repeat-sale methodologies but controlling rigorously for selection bias, survivorship effects, and transaction costs find returns that fail to justify art's illiquidity premium relative to financial assets.
A 2020 study in The Review of Asset Pricing Studies examined the collection of John Maynard Keynes, tracking actual buy-and-hold performance of a real portfolio rather than theoretical index construction. The analysis identified factors that explain why individual returns can substantially diverge from market returns: transaction-specific risk, buyer heterogeneity, return skewness, and portfolio concentration. The findings highlighted limitations of art price indexes as guides to asset allocation or performance benchmarking.
The gap between academic and industry index results reflects different purposes rather than methodological incompetence. Industry indices serve marketing functions, demonstrating art's investment appeal to potential collectors and validating the services of galleries, auction houses, and advisors. Academic studies seek to answer whether art makes sense as financial investment. Different purposes produce different methodologies and different conclusions.
Methodological Debates and Future Directions
The Transparency Problem
The art market's opacity remains its most persistent characteristic, and indices reflect rather than resolve this fundamental challenge. When Sotheby's acquired the Mei Moses indices in 2016, critics noted that the auction house would now have "unique access" to findings—meaning the most sophisticated analytical tool available would primarily serve Sotheby's clients rather than the broader market. The consolidation of data resources within auction houses creates information asymmetry that may disadvantage independent collectors lacking institutional relationships.
Third-party data providers like Artnet and Artprice offer broader access, yet their business models depend on selling analytics services, creating potential incentive to present favorable narratives about art investment. The absence of an independent, academically rigorous public index comparable to Case-Shiller in real estate leaves collectors navigating between self-interested sources. Until art market data achieves the transparency standards of regulated financial markets, indices will reflect their creators' interests alongside market conditions.
The emergence of blockchain technology and distributed ledger systems has generated speculation about improved market transparency. Proponents argue that recording transactions on immutable public ledgers could create comprehensive price databases capturing both auction and private sales. Yet adoption remains limited, with established collectors and galleries showing reluctance to expose transaction histories that currently provide information advantages. The 2025 Deloitte and ArtTactic report noted that AI and blockchain are addressing long-standing valuation and provenance challenges, but transformative transparency improvements remain aspirational rather than operational.
Regional Index Variations
The 2026 Art Basel and UBS report documented significant regional variations in market performance that aggregate indices often obscure. While the US maintained its position as the largest market with 44% share and 5% growth to $26 billion, performance varied substantially across other regions. UK sales increased 2% to $10.5 billion, China stabilized at $8.5 billion with just over 1% growth despite real estate downturn concerns, and France surged 9% to $4.5 billion on strong performance in both auction and dealer sectors.
Switzerland and Austria each gained 13%, Spain and South Korea 6%, while Germany, Italy, and Japan showed weaker results. Collectors concentrating in specific regional markets may experience returns diverging significantly from global indices that weight heavily toward dominant markets. An investor focused on German contemporary art, for instance, might see portfolio performance bearing little resemblance to indices dominated by New York and London auction results.
These regional variations suggest opportunities for collectors willing to develop expertise in less-tracked markets. If indices underrepresent certain geographies while overweighting others, pricing inefficiencies may persist in regions with less analytical coverage. However, pursuing such strategies requires local expertise that most collectors lack and transaction costs in smaller markets may offset potential advantages.
The Technology Factor
Artificial intelligence and machine learning applications increasingly inform art valuation, potentially changing how future indices are constructed. Wondeur, cited in Morgan Stanley's analysis of art indices, uses artificial intelligence to recognize pricing patterns for 240,000 artists born after 1900 based on analysis of non-transactional drivers of value. Unlike traditional indices that rely on sales data, AI-driven approaches attempt to capture the influence of museum exhibitions, gallery representation, critical reception, and social media presence on artist trajectories before those factors manifest in transaction prices.
These approaches face their own methodological questions. Training AI models on historical data may perpetuate existing biases, potentially undervaluing artists from underrepresented backgrounds whose historical exclusion from institutional validation created data gaps. The models' complexity makes auditing difficult, and collectors cannot easily verify why an AI values a particular artist's work at a given level. Transparency concerns that apply to traditional indices may intensify with algorithmic approaches whose logic remains opaque.
For collectors, AI tools represent additional data sources rather than definitive guidance. The most sophisticated approach integrates algorithmic insights with traditional index data, qualitative research, and expert consultation rather than privileging any single methodology. As technology continues evolving, the collectors best positioned to benefit will be those who understand both traditional indices and emerging algorithmic alternatives without depending uncritically on either.
Frequently Asked Questions
What is the most reliable art market index currently available?
No single index provides complete market visibility, and reliability depends on your analytical purpose. For tracking blue-chip artist performance, the Sotheby's Mei Moses indices offer the longest history and most rigorous repeat-sale methodology, though access is limited primarily to Sotheby's clients. The Artprice100 provides broad visibility into top-performing artists with publicly available methodology, useful for understanding relative market direction. For the print market specifically, the MAB100 offers dedicated coverage incorporating both auction and private sale data. The most reliable approach combines multiple sources while understanding each methodology's limitations rather than treating any single index as definitive.
How should collectors interpret art market index returns when evaluating their own collections?
Index returns should be interpreted as market context rather than personal return expectations. A collector whose holdings include artists represented in major indices might reasonably expect their returns to correlate with index direction, though individual works will vary based on specific characteristics, condition, and market timing. More importantly, index returns are gross figures excluding transaction costs, holding costs, and taxes that typically reduce collector returns by 30-40% roundtrip. If an index shows 8% annual appreciation and your work appreciates similarly, your net return after all costs might be 4-5% annually or less, still meaningful but substantially below headline figures.
Why do art indices exclude private sales and unsold lots?
Methodological necessity rather than intentional bias explains these exclusions. Private sales lack public price disclosure, making inclusion impossible without voluntary reporting that currently doesn't exist at scale. Unsold lots present different challenges, as repeat-sale methodologies require two transactions to calculate appreciation, and a work that fails to sell completes only one transaction. Including unsold lots in broader indices would require assigning hypothetical values, introducing subjective assumptions that could compromise index integrity. These exclusions mean indices systematically overstate returns by including only successful transactions while excluding failures.
Can art serve as portfolio diversification despite index limitations?
Yes, though the diversification benefit derives from art's fundamental characteristics rather than index-derived return expectations. Art historically shows low correlation with financial markets because it operates on different value drivers including aesthetic appreciation, cultural significance, and collector competition rather than corporate earnings or economic growth. During 2022 when equities declined significantly, blue-chip art held relatively stable. However, correlation increases during severe liquidity crises, and art's illiquidity prevents rebalancing during market stress. Collectors with five-to-ten-year minimum horizons and sufficient liquid reserves gain genuine diversification benefit; those requiring liquidity should weight exposure accordingly.
What alternative metrics should collectors track beyond market indices?
Exhibition history, institutional acquisitions, and critical reception provide qualitative signals that indices cannot capture. Track which artists receive museum retrospectives, which galleries add representation, and which collections deaccession work by specific artists. Auction sell-through rates by artist reveal market depth beyond price appreciation, as high sell-through indicates consistent demand while low rates suggest market thinness. Compare primary market gallery prices to secondary market auction results to identify artists whose work appreciates after initial gallery sale. Finally, monitor artist-specific factors including exhibition schedule, health, and estate planning that affect supply dynamics beyond market-wide trends.
Ready to navigate art markets with intelligence beyond index headlines? Visit Artestial where collectors access institutional-quality research and curated selections with transparent provenance, or connect with specialists for guidance developing data-informed collection strategies.
Curating excellence, one insight at a time.
— AURUM Team
Disclaimer: This article provides educational information about art market indices and should not be construed as investment, financial, or legal advice. Art markets involve substantial risks including illiquidity, price volatility, and the potential for total loss. Index returns reflect theoretical calculations that do not account for transaction costs, holding costs, or taxes, and individual collector returns may differ materially from index performance. All market data derives from publicly available sources including the 2026 Art Basel and UBS Global Art Market Report, Artprice publications, and industry commentary. Readers should consult qualified financial, legal, and art advisory professionals before making acquisition or disposition decisions.